Mermaid
ダイアグラムやフローチャートなどの図を作成できる Mermaid のプラグインは mermeid-gb3 を使います.
{
    "plugins": ["mermaid-gb3"]
}
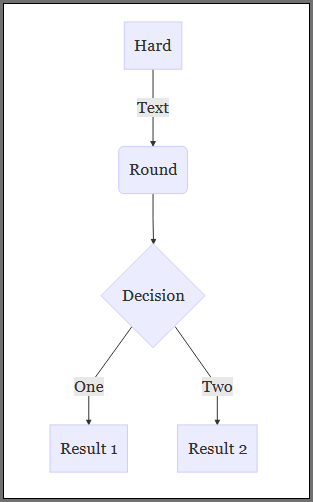
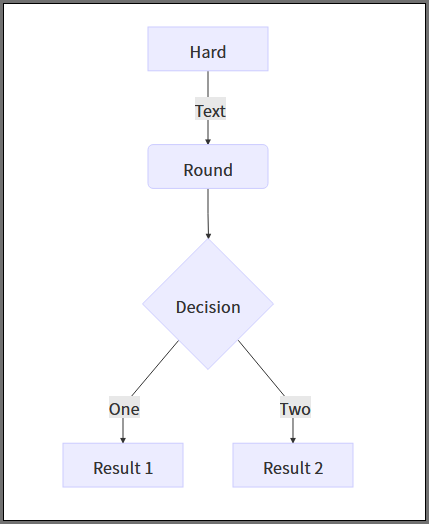
次のように使います.
```mermaid
graph TD
A[Hard] -->|Text| B(Round)
B --> C{Decision}
C -->|One| D[Result 1]
C -->|Two| E[Result 2]
```
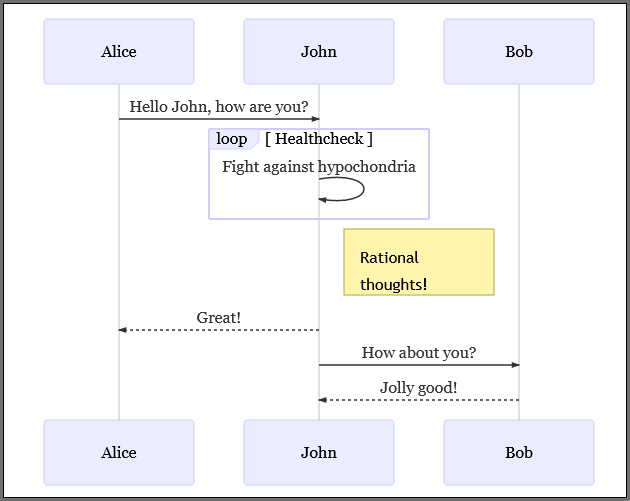
```mermaid
sequenceDiagram
Alice->>John: Hello John, how are you?
loop Healthcheck
    John->>John: Fight against hypochondria
end
Note right of John: Rational thoughts!
John-->>Alice: Great!
John->>Bob: How about you?
Bob-->>John: Jolly good!
```
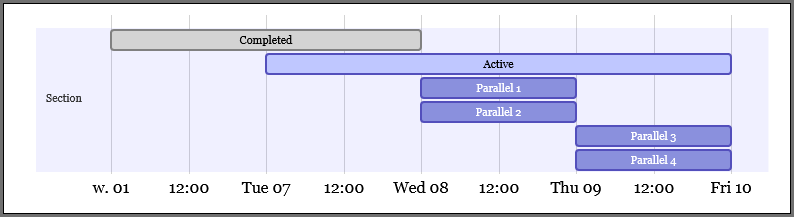
```mermaid
gantt
section Section
Completed :done,    des1, 2014-01-06,2014-01-08
Active        :active,  des2, 2014-01-07, 3d
Parallel 1   :         des3, after des1, 1d
Parallel 2   :         des4, after des1, 1d
Parallel 3   :         des5, after des3, 1d
Parallel 4   :         des6, after des4, 1d
```
フォントを標準から変更したところ,フローチャートでは表示が一部切れてしまっていました.
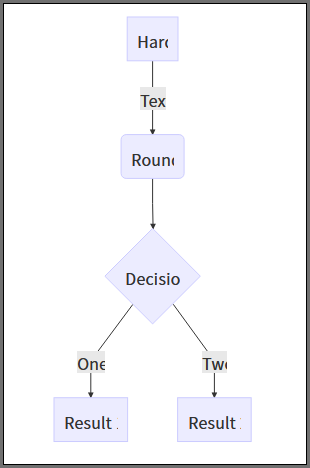
根本的な解決方法はわかっていないのですが,例えばスタイルシートを次のように調整すると
g.label foreignObject {
  width: 100px;
  text-align: center;
}

g.label foreignObject span.edgeLabel {
  margin-left: -70px;
}
いい感じに見えますが,固定幅になっていますので図によって再調整しなければなりません.